
India’s mainboard segment recorded over 90 IPO listings in FY2025, raising more than ₹1.6 lakh crore — the highest single-year fundraising in Indian primary market history. Yet according to NSE and BSE exchange data, approximately 30–35% of those IPOs listed below their issue price within the first 30 trading days. Subscription levels in the RII category ranged from 10x to over 300x across those same issues, proving that oversubscription is a poor predictor of listing performance.
The investors who avoided losses understood how to analyse an IPO before applying. The ones who lost capital made decisions based on GMP notifications, broker alerts, and social media momentum. This article covers the complete analytical framework — reading the DRHP, evaluating financials, assessing valuation, and applying a structured checklist — so retail investors can tell the difference between an IPO worth applying for and one worth skipping.
Why Most Retail Investors Apply Without Researching
Three patterns drive uninformed IPO applications in India, and all three are widespread.
GMP-chasing. The Grey Market Premium — an informal pre-listing price traded outside exchange platforms with zero SEBI oversight — has become the dominant decision signal for a large segment of retail investors. Broker apps and Telegram channels publish GMP figures daily during subscription periods, and many investors treat a high GMP as confirmation that the IPO is worth applying for. It is not.
Push-alert urgency. Broker apps send notifications during subscription windows that communicate urgency — “IPO closes tomorrow” or “₹X crore oversubscribed” — without providing any financial analysis. These alerts create time pressure that bypasses rational evaluation.
Social media momentum. High-profile IPOs generate coverage across investor forums, X (formerly Twitter), and YouTube channels, creating peer pressure to apply before analysing whether the business justifies the valuation.
The consequence is predictable. Investors who know how to analyse an IPO consistently make better entry decisions than those who rely on any of these three signals. Capital protection begins at the analysis stage, not after allotment.
The GMP Trap
GMP is an informal price traded in grey markets — unregulated, with no exchange clearing and no legal recourse for participants. It reflects speculative demand from a small pool of grey market operators, not fundamental value derived from financial analysis.
In FY2024–25, multiple IPOs with pre-listing GMPs above 40–50% listed flat or at discounts of 5–15% on day one. The pattern is consistent enough that treating GMP as a secondary rather than primary signal — or ignoring it entirely in favour of fundamentals — produces better average outcomes over a full IPO application cycle.
How to Analyse an IPO — Starting With the DRHP
The starting point of any IPO analysis is the document that contains every fact an investor needs: the DRHP (Draft Red Herring Prospectus). SEBI requires all companies to file the DRHP publicly before listing — it appears on SEBI’s filings portal, the company’s investor relations page, and the exchange websites of NSE and BSE.
The DRHP contains every material disclosure about the company, but most retail investors never open it. Understanding how to analyse an IPO correctly starts with knowing which four sections to read and in what order.
Objects of the Issue — use of proceeds. This section reveals whether IPO capital goes toward growth (capex, R&D, new facilities, acquisitions) or liability management (debt repayment, general corporate purposes). A company directing ₹800 crore of a ₹1,200 crore fresh issue toward debt repayment is funding its balance sheet repair, not its growth.
Risk Factors — material disclosures. Every company must disclose business, regulatory, financial, and operational risks. Investors do not need to read all 50–80 risk factors, but scanning for recurring patterns — regulatory risk, customer concentration, pending litigation — takes 10 minutes and surfaces genuine concerns.
Financial Statements — three years of restated data. Revenue growth, profit margin, debt-to-equity, cash flow — the core of any IPO financial analysis.
Management Discussion and Analysis (MD&A) — the narrative behind the numbers. Management’s own commentary on business performance, which when read alongside the financials, reveals whether the story matches the numbers or contradicts them.
Fresh Issue vs. OFS — What the Issue Structure Reveals
The IPO issue size breaks into two components: fresh issue and OFS (Offer for Sale). The distinction changes the entire investment thesis.
A fresh issue puts new capital directly into the company’s balance sheet — it can retire debt, fund expansion, or add working capital. An OFS transfers shares from existing holders — promoters, PE investors, early-stage shareholders — to new public investors. Zero proceeds enter the company. The balance sheet is unchanged post-IPO.
Hyundai India’s October 2024 IPO — at ₹27,870 crore, the largest in Indian history — was structured entirely as an OFS by the parent, Hyundai Motor Company Korea. No fresh capital entered the Indian entity. This is not inherently negative: Hyundai India is a profitable, well-run business. But investors bought from a seller, not from a company raising growth capital. For smaller, high-growth companies, a large OFS component — especially by PE investors at IPO — warrants scrutiny: why are insiders exiting rather than holding for further upside?
How to Analyse an IPO’s Financials — The Numbers That Actually Matter
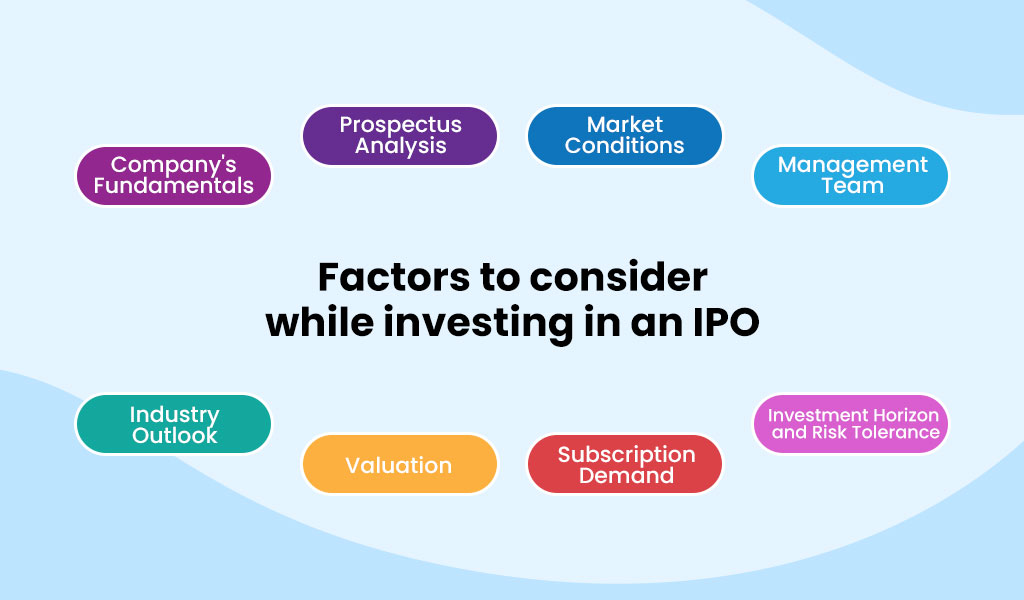
IPO financial analysis is not about reading every page of restated accounts — it is about checking five numbers consistently and knowing what each signals.
1. Revenue growth (3-year trend). Pull three years of annual revenue from the restated P&L. A company growing revenue at 20–25% CAGR consistently demonstrates real business momentum. A company that grew 5% in FY2022, 7% in FY2023, and then 60% in FY2024 (the IPO year) may have staged its listing at a cyclical or promotional peak. Single-year spikes without multi-year trend support are a yellow flag.
2. Profit margin. Compare EBITDA margin and PAT margin against listed industry peers. If an IPO company earns an EBITDA margin of 12% while its three closest listed competitors average 18–22%, it either has a structural cost disadvantage or operates in a lower-value segment. IPO fundamentals include understanding whether the business produces industry-standard profitability.
3. Debt-to-equity ratio. A company with a D/E of 2.5x listing at a high premium while planning to use IPO proceeds for debt repayment is asking public investors to subsidise its balance sheet repair. Low debt at IPO with proceeds directed toward growth is a materially different profile.
4. Operating cash flow. A company can report PAT profit while burning cash — through aggressive revenue recognition, deferred payments, or working capital expansion. Operating cash flow positive for at least two of the three years in the restated financials is a stronger business quality signal than accounting profit alone.
5. ROE and ROCE. Return on Equity and Return on Capital Employed measure management’s efficiency at deploying investor capital. An IPO company with 8% ROE in a sector where peers average 18–22% is a structurally weaker business, regardless of its growth narrative.
Reading the DRHP Financials in Under 20 Minutes
The “Restated Financial Information” section of the DRHP contains three years of audited P&L statements, balance sheets, and cash flow statements on consecutive pages. Finding it takes 30 seconds with Ctrl+F searching “Restated Financial.”
Four specific checks within the financials: (1) check year-over-year revenue and PAT consistency rather than any single-year figure; (2) scan notes to accounts for related-party transactions — unusually high promoter remuneration or large loans to group companies can indicate capital extraction; (3) verify whether the auditor is a Big 4 firm (Deloitte, PwC, EY, KPMG) or a well-known mid-tier auditor (BDO, Grant Thornton) — for an IPO raising above ₹500 crore, an unknown or recently changed auditor warrants additional scrutiny; (4) check the auditor’s report for qualifications — any paragraph that qualifies a specific accounting treatment is a flag that deserves a second read.
Valuation — Determining Whether the IPO Price Is Actually Fair
Completing the how to analyse an IPO process without a valuation check produces the most common retail investment mistake: buying a good business at a price that makes returns impossible for years. The best business at the wrong price is still a poor investment.
PE ratio. The most widely used valuation metric — issue price divided by earnings per share. An IPO priced at 60x trailing PE when its three closest listed peers trade at 25–30x asks investors to price in multiple years of future earnings growth before a single rupee of that growth has materialised.
Price-to-Sales (P/S). For loss-making companies — common among new-age tech, fintech, and D2C brands — PE is inapplicable. P/S compares market cap to annual revenue. Listed peer comparison is the anchor here, just as with PE.
EV/EBITDA. Preferred for capital-intensive industries — manufacturing, telecom, infrastructure — where depreciation distorts PE. Enterprise Value divided by EBITDA strips out capital structure differences and allows cleaner cross-company comparison.
Price-to-Book (P/B). The primary valuation lens for financial companies (banks, NBFCs, insurance) where book value represents the core asset base. Most quality private sector banks in India trade at 2.5–4x P/B. An NBFC IPO at 6x P/B demands a clear quality justification.
PEG ratio. PE divided by annual earnings growth rate. A company with 30x PE and 40% earnings growth has a PEG of 0.75 — reasonable despite the headline PE number. A company with 60x PE and 15% earnings growth has a PEG of 4.0 — stretched by almost any standard.
The Peer Comparison Table — The Most Actionable Page in the RHP
SEBI mandates that every RHP include a peer comparison table showing the IPO company and its listed competitors with their P/E, EV/EBITDA, and ROE ratios. This table is the single most actionable page in any RHP for a retail investor’s IPO valuation analysis.
Three things to check: (1) whether the IPO prices at a discount, at par, or at a premium to peers — and if at a premium, what justifies it (higher growth, better margins, stronger market position, proprietary technology); (2) whether the peer set was selectively chosen — a fast-growing consumer brand comparing itself to slow-growth FMCG peers makes itself look cheap on current multiples while potentially being expensive on growth-adjusted ones; (3) whether all peers are genuinely comparable by sector, geography, and business model, since surface-level PE comparisons between dissimilar businesses mislead more often than they help.
Green Flag vs. Red Flag — The IPO Screening Checklist
Every step of how to analyse an IPO covered in this article compresses into the screening checklist below. Run through these ten dimensions at the start of any IPO evaluation to identify whether an issue clears the minimum bar for deeper research.
| Dimension | Green Flag | Red Flag |
|---|---|---|
| Objects of issue | Majority proceeds toward capex, R&D, or growth | Majority proceeds toward debt repayment or general corporate purposes |
| Issue structure | Significant fresh issue component | 100% OFS — no fresh capital enters company |
| Revenue growth | Consistent 20%+ CAGR over 3 years | Single-year spike in IPO year; flat or declining prior years |
| Profit margin | At or above listed peer average | Structurally below peers with no clear path to convergence |
| Debt-to-equity | D/E below 1x, or declining trend | D/E above 2x with IPO proceeds partly or fully funding repayment |
| Operating cash flow | Positive in at least 2 of 3 restated years | Negative or deteriorating despite reported profit |
| Promoter holding post-IPO | Promoters retain 50%+ stake post-listing | Promoter stake below 35% post-IPO; large OFS by promoters |
| IPO valuation vs. peers | At par or modest premium to sector average PE | 50%+ premium to sector peers with no margin or growth justification |
| Auditor quality | Big 4 or established mid-tier; clean opinion | Unknown auditor, recent auditor change, or qualified opinion |
| Industry tailwinds | Operating in a growing sector with regulatory support | Commoditised, capital-heavy sector with pricing pressure |
No IPO delivers a clean sweep of green flags — every issue involves trade-offs. The practical application: four or more red flags in the same IPO warrants either skipping the application or waiting for secondary market prices post-listing, which are often more favourable than issue price for fundamentally weak IPOs. The combination that most reliably produces post-listing returns is strong fundamentals plus reasonable valuation, not high GMP or heavy oversubscription.
IPO Analysis Checklist — Five Steps in the Subscription Window
A retail investor has 3–5 days to decide on any live IPO application. These five steps — each executable in under 10 minutes — cover everything needed for how to analyse an IPO within a live subscription window.
Step 1: Read Objects of the Issue (5 minutes). Open the RHP, go directly to the Objects of the Issue section, and identify where the money goes. This single check eliminates the most common category of poor IPO investments.
Step 2: Check 3-year revenue and PAT trend (5 minutes). Ctrl+F “Restated Financial,” find the revenue and PAT rows, and look for consistency. A 3-year compounding trend matters far more than the FY2024 or FY2025 standalone number.
Step 3: Run the PE comparison (5 minutes). Look up the peer comparison table in the RHP. Check the IPO’s PE against listed peer average PE. If the premium to peers is above 40–50% with no clear qualitative justification, flag it.
Step 4: Check promoter holding and issue structure (3 minutes). The shareholding pattern pre- and post-IPO is in the RHP cover section. If promoters are selling heavily at IPO through OFS while retaining minimal stake, that is a structural signal worth weighing.
Step 5: Verify auditor and check for qualifications (3 minutes). Search the auditor’s report for any qualifications or emphasis-of-matter paragraphs. A qualified audit opinion on an IPO should give any investor pause regardless of how attractive the business appears on the surface.
Running all five steps takes under 30 minutes. Most retail investors spend longer deciding which colour phone case to buy.
Frequently Asked Questions
How to analyse an IPO before investing as a first-time applicant?
First-time applicants should start with three documents: the RHP (or DRHP), the peer comparison table within the RHP, and publicly available financial data for listed peers from NSE or BSE. The process for how to analyse an IPO as a first-timer is identical to the process for experienced investors — it is a matter of time investment, not expertise. Focus on Objects of the Issue (where does the money go), 3-year revenue and PAT trend, and whether the IPO PE is at par or at an extreme premium to listed peers. These three checks take under 30 minutes and filter out the majority of structurally weak IPOs.
What is the difference between DRHP and RHP?
The DRHP (Draft Red Herring Prospectus) is the document filed with SEBI for regulatory review — it contains placeholder data for issue price and allotment details. The RHP (Red Herring Prospectus) is the final document filed after SEBI approval, with actual issue price band, allotment schedule, and updated financials. For analysis purposes, the RHP is the definitive document and the one retail investors should reference during a live IPO subscription window.
Is GMP a reliable indicator for IPO listing performance?
No. GMP (Grey Market Premium) is an unregulated informal market price with no exchange oversight and no legal framework. It reflects speculative demand from grey market operators, not fundamental value. Multiple IPOs in FY2024–25 with pre-listing GMPs of 40–50% listed flat or below issue price. GMP should be treated as noise — useful for gauging retail excitement, but irrelevant to financial analysis.
What does a 100% OFS IPO mean for investors?
A 100% OFS (Offer for Sale) IPO means that no fresh capital enters the company — existing shareholders are selling their stakes to new investors. The company’s balance sheet is unchanged post-listing. This does not automatically make the IPO unattractive: a profitable, well-run company selling shares through OFS can still be a good investment at the right valuation. The key question is whether the PE is justified relative to listed peers and what the sellers’ motivation is for exiting at IPO rather than holding for further appreciation.
How do I find the peer comparison table in the RHP?
Search “Basis for Issue Price” or “Comparison with Listed Industry Peers” in the RHP using Ctrl+F. SEBI mandates this section in every prospectus — it lists the IPO company’s PE, EV/EBITDA, and ROE alongside those of its named listed competitors.
Investment Disclaimer
The information in this article is for educational purposes only and does not constitute investment advice, a recommendation to buy or sell securities, or an offer or solicitation to participate in any IPO. IPO investments carry market risk — past listing performance is not indicative of future results. Investors should read all offer documents carefully, consult a SEBI-registered investment advisor if required, and make independent investment decisions based on their own risk tolerance and financial goals.
The Analysis Is the Edge
Learning how to analyse an IPO is not about predicting listing-day performance — no framework does that reliably. It is about applying a repeatable process that separates businesses worth owning from businesses being sold at prices that prevent returns. Over a full cycle of IPO applications, investors who run this framework outperform those who rely on GMP, subscription levels, or broker notifications — not because every application succeeds, but because the ones that fail cost significantly less.
For investors ready to put this analysis into practice, the upcoming IPOs in India 2026 pipeline offers several live opportunities across mainboard and SME segments. The businesses are there — the question is whether the price is right.
The framework covered in this article — DRHP reading, financial checks, valuation benchmarking, and the green vs. red flag checklist — takes under 30 minutes per IPO once applied consistently. Investors who build the habit of running how to analyse an IPO on every issue, rather than only the ones their broker flags, make better allocation decisions over time. The analysis is not a guarantee. It is an edge.