
The Dow Jones stock market is not a market. It is a price-weighted index of 30 large American companies traded on the New York Stock Exchange and Nasdaq, and it moves Indian markets every single morning before NSE opens. When the Dow Jones Industrial Average today closes sharply lower on Wall Street, Nifty 50 futures fall in GIFT Nifty overnight, and Indian retail investors wake up to red screens. As of the week ending November 6, 2026, the Dow Jones Industrial Average (DJIA) stood at 51,285.73, up 6.15% year-to-date, while the S&P 500 sat at 7,376.86 and the Nasdaq Composite at 24,579.42. Understanding what drives the Dow Jones stock market is no longer optional for Indian investors tracking IPO listings, blue-chip holdings, or FII flows into Indian equities.
Dow Jones Stock Market at a Glance
| Parameter | Detail |
|---|---|
| Full Name | Dow Jones Industrial Average (DJIA) |
| Common Name | The Dow / Dow Jones 30 |
| Index Type | Price-weighted stock market index |
| Number of Components | 30 companies |
| Exchanges | NYSE and Nasdaq |
| Base Value | 40.94 points (May 26, 1896) |
| Index Operator | S&P Dow Jones Indices |
| Level (Nov 6, 2026) | 51,285.73 |
| YTD Performance (2026) | +6.15% |
| Trading Hours (EST) | 9:30 AM to 4:00 PM (Mon to Fri) |
| Indian Time Equivalent | 7:00 PM to 1:30 AM IST |
| Relevance to India | FII sentiment, overnight GIFT Nifty signal, rupee-dollar movement |
Source: StockMarketWatch weekly report, week of November 2, 2026.
How the Dow Jones Stock Market Is Calculated
The Dow Jones stock market index uses a price-weighted calculation, which means a higher-priced stock contributes more to the index’s movement than a lower-priced one, regardless of the company’s total market value. If Goldman Sachs trades at USD 600 and Nike trades at USD 90, Goldman Sachs exerts roughly 6.7 times more influence on the Dow than Nike, even if Nike’s market capitalisation is comparable.
The calculation uses the Dow Divisor, currently approximately 0.152. This divisor adjusts automatically whenever a component stock splits or when S&P Dow Jones Indices adds or removes a company. The formula: sum of all 30 component stock prices divided by the Dow Divisor equals the Dow Jones level.
The percentage change matters far more than the absolute point move. A 500-point fall in the Dow when the index stands at 51,000 is a 0.98% decline, a mild correction. The same 500-point fall in 2009, when the Dow stood at 8,000, was a 6.25% crash. Indian financial media often reports point moves, which can mislead investors into overreacting.
The Dow differs sharply from other US indices. The S&P 500 tracks 500 companies and uses market-cap weighting, making it the broader US market benchmark that most FIIs use. The Nasdaq Composite covers roughly 3,500 companies and skews heavily toward technology and growth stocks. The Russell 2000 covers US small-cap stocks. For tracking the American stock market’s overall health, the S&P 500 is more representative than the Dow. For sentiment on large-cap blue-chip stocks, the DJIA remains the most-watched single figure in the US equity market.
Dow Jones 30 Components: The Blue-Chip Stocks Behind the Index
The Dow Jones 30 consists of 30 companies selected by the S&P Dow Jones Indices committee. No fixed quantitative formula governs selection. The committee chooses companies that it believes represent the breadth of the US economy. Component changes are infrequent but significant: Amazon was added in February 2024 when Walgreens was removed, shifting the index’s tilt toward e-commerce and consumer technology.
| Sector | Representative Dow Components |
|---|---|
| Technology | Apple, Microsoft, IBM, Salesforce, Cisco |
| Financials | Goldman Sachs, JPMorgan Chase, Visa, American Express |
| Healthcare | UnitedHealth Group, Johnson and Johnson, Amgen |
| Industrials | Boeing, Caterpillar, Honeywell, 3M |
| Consumer | McDonald’s, Nike, Walmart, Procter and Gamble, Coca-Cola |
| Energy / Other | Chevron, ExxonMobil, Dow Inc. |
The highest-priced stocks by share price drive the most index movement. Goldman Sachs, UnitedHealth Group, and Microsoft have consistently ranked among the top-weight Dow Jones components. This is why a sharp fall in one high-priced stock (such as UnitedHealth’s -17% move in mid-2026 cited by Seeking Alpha as the biggest Dow 30 YTD loser) exerts outsized pressure on the Dow Jones benchmark index while the S&P 500 and Nasdaq may move differently on the same day. The full list of Dow Jones constituents is published and updated at the S&P Dow Jones Indices website.
Tracking Dow Jones Stock Market Today: A Practical Guide for Indian Investors
Indian investors need two distinct reference points, not one: Dow Jones today live closing data for next-morning outlook, and pre-market Dow futures for intraday sentiment.
For live Dow Jones data:
- MarketWatch and Yahoo Finance (ticker: ^DJI) provide free real-time and delayed quotes
- Google Finance search “Dow Jones” shows the current level and 1-day chart
- Zerodha Kite’s global indices section and INDmoney both display US indices for Indian users
For pre-market Dow futures: Dow futures begin trading at 6:00 AM EST (3:30 PM IST), well before the Indian market closes at 3:30 PM IST. A rising Dow futures at 3:30 PM IST is an early indicator that the US session may open positively that evening. Dow futures are not identical to Dow Jones today live; futures carry a premium or discount to the spot index.
When Indian investors should check: Checking Dow Jones market performance today before 9:15 AM IST (the NSE open) gives a gap-open signal for Indian markets. The most useful check combines the previous night’s Dow Jones closing change percentage with the GIFT Nifty level at 8:00 AM IST. A -1.5% Dow close paired with a 200-point GIFT Nifty fall tells Indian investors far more than either figure alone.
A critical distinction: “Dow fell 300 points” sounds alarming. “Dow fell 0.6%” is a routine fluctuation. Always convert the Dow’s daily change into a percentage before reacting.
How the Dow Jones Stock Market Moves Indian Markets
The connection between Wall Street and Dalal Street runs through four specific channels. Indian retail investors who understand these channels react proportionately instead of panicking.
FII and FPI Flows
Foreign Institutional Investors and Foreign Portfolio Investors manage global allocations. When the Dow Jones drops 1,000 points or more, US-based fund managers often de-risk globally, reducing exposure to emerging markets including India. NSE publishes provisional FII buy/sell data by 7:00 PM on each trading day. A 2% Dow fall the previous evening followed by FII net selling above Rs 3,000 to Rs 5,000 crore in India the next session confirms the risk-off sentiment has reached Indian markets. NSE India publishes this data under the FII/FPI activity section.
GIFT Nifty Overnight Signal
The SGX Nifty, now rebranded as GIFT Nifty and trading at the GIFT City exchange in Gujarat, prices Nifty 50 futures overnight. By 8:00 AM IST, GIFT Nifty incorporates the full Dow Jones closing, Asian market early moves, and any India-specific news. Indian traders treat GIFT Nifty as a gap-open indicator. A GIFT Nifty reading 150 points below the previous NSE close implies a 0.3% gap-down opening. For upcoming IPO listings on that morning, a negative GIFT Nifty is a direct risk to listing gains. Indian investors tracking the upcoming IPOs in India 2026 calendar should factor GIFT Nifty on listing morning into their exit decisions.
Rupee-Dollar and Its Effect on Indian Stocks
A sharp Dow fall typically triggers safe-haven demand for the US dollar, pushing the dollar higher and the Indian rupee weaker. A weaker rupee raises import costs across oil, electronics components, and industrial raw materials. Import-dependent Indian companies (refiners, consumer electronics firms, capital goods manufacturers) face margin compression when the rupee weakens. This chain links a Wall Street selloff to specific NSE sectors within 24 hours. The rupee-dollar rate on any morning after a large Dow fall is the second data point to check alongside GIFT Nifty.
US Market Performance and Indian IPO Timing
Investment bankers and Indian IPO promoters monitor the US equity market closely before setting subscription windows. A sustained Dow Jones rally (2 to 3 months of consistent gains) typically encourages Indian companies to launch IPOs on BSE and NSE, as FII appetite for equities is highest. A Dow correction of 5% or more often causes IPO launches to defer by 4 to 8 weeks. For context on how mainboard and SME IPO structures handle market volatility differently, see the Mainboard IPO vs SME IPO comparison on ipocontrol.in.
Dow Jones Stock Market vs S&P 500 vs Nasdaq: Which Matters Most for Indian Investors?
Indian financial news leads with the Dow, but sophisticated Indian investors track all three major US indices. The comparison below shows why each serves a different purpose.
| Parameter | Dow Jones (DJIA) | S&P 500 | Nasdaq Composite |
|---|---|---|---|
| Number of Stocks | 30 | 500 | ~3,500+ |
| Weighting Method | Price-weighted | Market-cap weighted | Market-cap weighted |
| Sector Focus | Diversified blue-chip | Broad US economy | Technology-heavy |
| Best Represents | Large-cap industrial US | Entire US market | US tech and growth |
| Correlation with Nifty 50 | High (sentiment) | Higher (FII benchmark) | High (tech FII flows) |
| Indian Media Coverage | Very high | High | Moderate |
| Used by Indian FIIs as benchmark | Less common | Most common | For tech allocations |
| Volatility | Lower | Moderate | Higher |
| Useful for Indian investors | Opening sentiment signal | FII flow predictor | Indian IT sector impact |
| Level (Nov 6, 2026) | 51,285.73 | 7,376.86 | 24,579.42 |
| YTD 2026 | +6.15% | +~5% | +~4% (est.) |
Most global funds benchmark their equity allocations to the S&P 500, not the Dow. When S&P 500 falls more sharply than the Dow on the same day, it signals broad US market weakness beyond the 30 Dow blue-chips, which typically produces heavier FII selling in India. For Indian IT stocks specifically, the Nasdaq is the more relevant index because US tech earnings drive IT sector order books and FII allocations to Indian IT companies like Infosys, TCS, and Wipro.
Dow Jones Index Forecast 2026: What Analysts Are Projecting
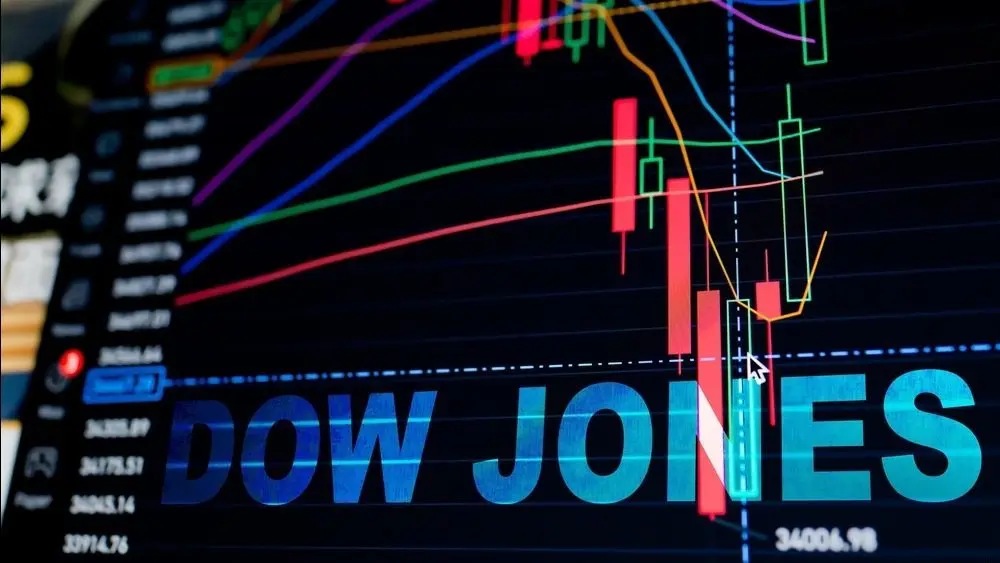
Wall Street entered 2026 with unanimous bullish consensus. As of December 2025, JPMorgan set a 2026 S&P 500 target of 7,500 (with a path above 8,000 on aggressive Fed cuts), Morgan Stanley projected 7,800, Deutsche Bank set 8,000, and Wells Fargo matched 7,800. These translate to Dow Jones implied targets in the 52,000 to 58,000 range based on the historical Dow-to-S&P ratio, though banks rarely publish explicit Dow Jones index forecast 2026 targets separately. Goldman Sachs raised its S&P 500 target to 8,000 by mid-2026.
As of November 2026, with the Dow at 51,285 (up 6.15% YTD), the index has underperformed the most bullish year-end targets but remains in positive territory for the year.
Key upside drivers cited by analysts:
- US Federal Reserve rate cuts in H1 2026 reducing borrowing costs
- AI-driven capital expenditure boosting technology earnings
- Strong US corporate earnings with 13 to 15% projected growth
- Expanding market leadership beyond mega-cap tech stocks
Key risk factors for 2026:
- AI valuations forming a speculative bubble (noted by Wells Fargo and JPMorgan)
- Inflation resurgence delaying Fed rate cuts
- US-China trade tensions affecting industrial and technology components
- K-shaped economy with lower-income consumer weakness
For Indian investors: These index prediction targets are US portfolio allocation tools, not signals for Indian market timing. Indian equity performance depends on RBI rate decisions, monsoon and agricultural output, domestic earnings growth, and rupee stability, not US analyst year-end numbers. Use these forecasts as macro context. For the latest DJIA news and analyst updates, Reuters Markets and Bloomberg Markets provide daily coverage. Live Dow data is available at MarketWatch.
Six Practical Tips for Indian Investors Following the Dow Jones Stock Market
1. Check GIFT Nifty, not just the Dow closing, before NSE opens. GIFT Nifty at 8:00 to 9:00 AM IST incorporates Dow Jones sentiment filtered through Asian market reaction and India-specific factors. It is a more precise gap-open signal than the raw Dow Jones figure from 1:30 AM IST.
2. A 1% Dow fall does not mean a 1% Nifty fall. The correlation is directional, not proportional. Indian markets often recover intraday after a gap-down open as domestic factors dominate from 11:00 AM onward. Panic-selling at the NSE open based on overnight Dow data is one of the most common retail investor mistakes, and one of the most costly.
3. Watch FII data the morning after a major Dow swing. NSE publishes provisional FII buy/sell figures by 7:00 PM on trading days. A large Dow fall followed by FII net selling above Rs 4,000 crore confirms that the global risk-off sentiment has reached Indian markets. FII buying despite a negative Dow is a strong contrarian signal for intraday recovery.
4. For IPO investors, a Dow correction in the week before listing is a red flag. A 2 to 3% Dow fall in the two or three days before an Indian IPO listing can suppress listing gains. Tracking Dow Jones market performance today in the days surrounding a major listing date helps investors set realistic expectations. Check real-time allotment and listing updates at IPO Allotment Status on ipocontrol.in.
5. Use the S&P 500 for FII flow analysis, not just the Dow. Most global funds benchmark to the S&P 500. When the S&P 500 falls more than the Dow on the same day, broad US market weakness is spreading beyond the 30 Dow components, and FII outflows from India are typically heavier on the following session.
6. Do not use DJIA or S&P 500 year-end targets to time Indian market entry. Analyst forecasts for US indices serve US portfolio allocation decisions. Indian market valuations, RBI monetary policy, domestic earnings, and rupee strength are far more direct drivers of Nifty and Sensex than any Wall Street year-end Dow target.
Frequently Asked Questions: Dow Jones Stock Market
Q1. What is the Dow Jones stock market and how does it differ from the S&P 500? The Dow Jones stock market refers to the Dow Jones Industrial Average, a price-weighted index of 30 large US companies on NYSE and Nasdaq. The S&P 500 tracks 500 companies using market-cap weighting, giving a broader picture of the US equity market. Indian FIIs benchmark primarily to the S&P 500 for asset allocation, but the Dow gets more Indian media coverage because of its 130-year history and simpler headline figure.
Q2. How does Dow Jones today live performance affect Indian markets the next morning? A sharp Dow Jones fall pushes GIFT Nifty futures lower overnight, signalling a gap-down opening for NSE and BSE. US-based FIIs typically pull money from emerging markets including India after a major Dow correction, creating selling pressure on Nifty 50. The rupee-dollar rate after a Dow fall is the second data point to watch, as dollar strength from safe-haven demand weakens the rupee and squeezes import-dependent Indian sectors.
Q3. Where can Indian investors find Dow Jones stock market latest news and live data? Google Finance (search “Dow Jones”), Yahoo Finance (ticker ^DJI), WSJ Markets, and MarketWatch offer free live and delayed data. The Dow Jones Industrial Average today figure appears in the global indices section of Zerodha Kite, Groww, and INDmoney. For overnight push alerts before the NSE opens, the Moneycontrol app and Economic Times Markets app both send Dow Jones closing notifications.
Q4. What is the Dow Jones index forecast for 2026 and how should Indian investors use it? Wall Street targets for 2026 implied Dow levels of 52,000 to 58,000 based on S&P 500 forecasts from Morgan Stanley (7,800), JPMorgan (7,500 to 8,000+), and Deutsche Bank (8,000). As of November 2026, with the Dow at 51,285, it trades below the most bullish targets. Indian investors should treat these US index forecasts as macro context, not a timing tool for Indian equity decisions.
Q5. How many stocks make up the Dow Jones 30 and who selects them? The Dow Jones 30 comprises exactly 30 large US companies. The S&P Dow Jones Indices committee selects them based on their representation of the broader US economy across sectors. No fixed quantitative screen applies. The Dow Jones constituents change periodically: Amazon joined in February 2024 when Walgreens exited. The committee publishes changes with advance notice. The full Dow Jones components list is available at the S&P Dow Jones Indices website.
Disclaimer: This article is for educational and informational purposes only and does not constitute investment advice or a recommendation to buy, sell, or hold any securities. ipocontrol.in is not registered with SEBI as an investment advisor. Data on US indices, analyst forecasts, and FII flows cited above are sourced from public disclosures and financial data providers including StockMarketWatch, Yahoo Finance, Reuters, and Bloomberg. Readers must verify all figures from official sources. Consult a SEBI-registered investment advisor before making any investment decisions.
Final Word: Why Every Indian Investor Needs to Understand the Dow Jones Stock Market
The Dow Jones stock market is the single most-watched overnight signal for Indian equity investors. FII flows, GIFT Nifty, and rupee-dollar movement all respond to Dow direction within hours of Wall Street closing. Indian retail investors tracking IPO listings, Nifty 50 holdings, or sector-specific bets in IT and manufacturing should monitor the Dow Jones stock market today as part of a daily pre-market routine, while keeping domestic factors such as RBI policy, domestic earnings, and FII provisional data as the primary decision drivers. For the full 2026 IPO pipeline and IPO GMP Today signals alongside global market context, ipocontrol.in publishes the upcoming IPOs in India 2026 calendar updated daily.