
During the 2024-2025 SME IPO boom, retail investors submitted applications to over 90 SME issues in a single calendar year. Several of those IPOs listed below their issue price within 60 days , not because the businesses were fraudulent, but because investors paid prices that placed the stock at 80x, 100x, and in some cases 150x earnings. Understanding P/E ratio meaning in stock market before submitting a UPI mandate is not optional for a retail investor who wants to protect capital. This article covers the complete picture: the formula, the calculation, what a high or low reading signals, and how to apply it directly when reading an IPO Red Herring Prospectus.
P/E Ratio at a Glance
| Parameter | Detail |
|---|---|
| Full Form | Price to Earnings Ratio |
| Formula | Market Price per Share ÷ Earnings per Share (EPS) |
| Also Known As | PE ratio, price earnings multiple, earnings multiple |
| Data Type Needed | Current market price + annual/TTM EPS |
| Where to Find It | NSE/BSE company page, Screener.in, annual report |
| Used For | Stock valuation ratio, equity valuation, company comparison |
| Ideal Range | Context-dependent , sector, growth stage, market cycle |
| Caution Flags | Negative EPS makes PE meaningless; inflated by one-time gains |
The P/E ratio meaning table above gives a starting map. Full P/E ratio meaning , each row expands into a decision layer that separates an informed retail investor from one operating on GMP alone.
What Is P/E Ratio Meaning in Stock Market: The Core Definition
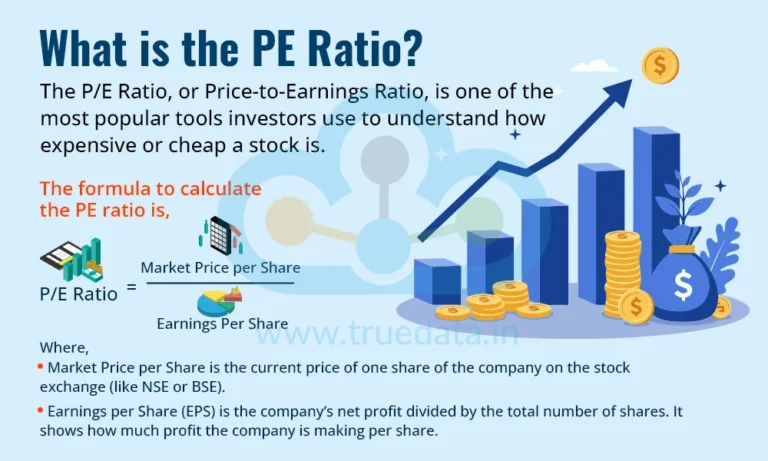
P/E ratio meaning in stock market is straightforward at its base: the price to earnings ratio tells an investor how much the market is paying for every one rupee of a company’s annual net earnings. If a stock trades at Rs 300 and the company earns Rs 15 per share each year, the market is collectively willing to pay Rs 20 for every Rs 1 of profit. That figure , 20 , is the PE ratio.
The ratio connects two numbers that live at opposite ends of the financial picture. Market price per share is determined by buyer and seller sentiment on NSE or BSE every trading day. Earnings per share (EPS) is an accounting figure drawn from the company’s profit and loss statement , net earnings divided by total outstanding shares.
As a stock valuation ratio, the PE ratio is one of the oldest tools in fundamental analysis. It does not tell an investor whether the company is well-managed, whether its product is growing, or whether debt will weigh on profits next year. It tells one thing only: the price the market assigns to the company’s current profitability. Equity valuation begins here, then moves outward to revenue trends, debt levels, and competitive position.
The PE ratio is not a buy or sell signal on its own. An investor who uses it in isolation, without sector context or earnings trend, will reach wrong conclusions more often than right ones.
P/E Ratio Formula: The Exact Calculation With a Real Example
The P/E ratio formula has two inputs:
P/E Ratio = Market Price per Share ÷ Earnings per Share (EPS)
Both numbers are publicly available for any listed company in India.
Breaking Down Each Component
The market price per share is the current traded price on NSE or BSE , not the face value printed on the share certificate (typically Rs 1 or Rs 10), not the book value from the balance sheet. It is the live price at which the stock changes hands.
Earnings per share is the company’s net earnings (profit after tax) divided by the total number of equity shares outstanding. Two versions matter: basic EPS uses the current share count; diluted EPS adds hypothetical shares that could arise from convertible instruments, employee stock options, or warrants. Diluted EPS is almost always lower than basic EPS, which means diluted PE is higher , more conservative. For IPO valuation, diluted EPS is the relevant figure.
The distinction between TTM EPS (trailing twelve-month earnings , the last four reported quarters) and annual EPS from the latest audited results matters when a company’s recent performance diverges from the full year. TTM EPS is more current and is the default figure on NSE and BSE company pages.
P/E Ratio Calculation Example
Company X trades at Rs 480 on NSE. Its TTM EPS is Rs 24.
P/E ratio = Rs 480 ÷ Rs 24 = 20x
The market pays Rs 20 for every Rs 1 of annual earnings. Now consider what happens if earnings fall without a change in share price: if TTM EPS drops to Rs 16 because of a weak quarter, the PE jumps to 30x , the stock has become more expensive despite the price being identical. That shift in the valuation multiple is what makes EPS trend as important as the PE ratio itself.
What Is a Good P/E Ratio for Indian Stocks
What is a good P/E ratio is the question most retail investors ask first , and it is the wrong starting point. “Good” has no universal number. It depends entirely on which sector the company operates in, what growth rate the market is pricing in, and where the broader market cycle sits.
The Nifty 50 has historically traded in a PE band of roughly 15x to 25x in normal market conditions. During the 2020-2021 bull run, it touched 40x. FMCG and consumer brand companies routinely trade between 30x and 55x because their earnings are visible, predictable, and grow steadily. IT companies in India command similar premiums. PSU banks and commodity producers frequently trade between 6x and 12x because their earnings are cyclical , they swing with commodity prices or interest rate cycles, making high multiples unsustainable.
For SME IPOs in India, a PE of 15x to 40x at the issue price is common. Above 60x, the burden of proof shifts to the company: it must demonstrate that its earnings runway justifies the premium. Above 80x on a company with less than three years of consistent profitability, the margin for error becomes very thin.
One scenario invalidates the PE ratio entirely: when a company reports a net loss, EPS is negative. A negative or undefined PE carries no analytical value , using it to make an investment decision is the equivalent of dividing by zero. In those cases, alternative stock valuation ratios such as EV/EBITDA or price-to-sales become the relevant company valuation tool.
High P/E Ratio vs Low P/E Ratio: What Each Signals
High P/E ratio vs low P/E ratio is not a question of which is better. P/E ratio meaning shifts depending on which side of this spectrum the reading falls. Each reading reflects a different set of market expectations about future earnings.
| Parameter | High P/E Ratio | Low P/E Ratio |
|---|---|---|
| What It Suggests | Market expects strong future earnings growth | Market expects slow growth or values asset base more |
| Typical Sectors (India) | IT, specialty chemicals, consumer brands | PSU banks, metals, utilities, real estate |
| Risk Profile | Vulnerable to earnings disappointment | May signal undervaluation , or a value trap |
| Price Sensitivity | Sharp fall if growth slows | Less downside if earnings stay stable |
| IPO Context | High-PE IPOs need strong GMP and subscription | Low-PE IPOs may offer margin of safety |
| Investor Perception | Growth stock | Value stock |
| Danger Sign | PE above 80-100x with no clear earnings runway | Consistently low PE with falling EPS |
A high price earnings multiple means the market is betting that earnings will grow significantly in the coming years and that the current PE, while elevated, will compress as profits catch up. The risk is that any earnings miss , a single weak quarter , can compress the price sharply, because the market re-prices the multiple before the next result confirms the growth story.
A low earnings multiple is not automatically a bargain. Companies in structurally declining sectors, or those facing regulatory pressure, can trade at a low PE for years while earnings continue to deteriorate. This is the value trap , a stock looks cheap on PE alone, but keeps getting cheaper as earnings fall. Cross-sector comparison using PE misleads: a PE of 15x on an IT company is inexpensive; a PE of 15x on a commodity metal producer may still be above its fair band. Comparing PE ratios within the same sector is the only comparison that produces actionable insight.
Types of P/E Ratio: Trailing vs Forward PE
Trailing P/E (TTM PE)
Trailing PE uses the last 12 months of actual reported earnings , trailing twelve-month earnings from audited or reviewed quarterly results. It is the more reliable of the two because it rests on numbers that have already been reported, not forecast. NSE and BSE company pages and platforms like Screener.in display TTM PE by default. For most retail investors evaluating a listed stock or an IPO peer, trailing PE is the relevant number.
Forward P/E
Forward PE substitutes analyst-estimated earnings for the next 12 months in place of actual TTM EPS. The estimate may or may not materialise. For established large-caps covered by 20 or more analysts, forward PE can be a reasonable planning tool , the consensus estimate narrows the error margin. For SME IPOs with no analyst coverage and a two-year operating history, forward PE is speculative by definition. An issuer who projects strong revenue growth in the RHP is effectively offering a forward PE argument , retail investors should locate the actual assumptions behind that projection before accepting it.
For the price-to-earnings calculation example in any IPO’s RHP, the “Basis for Issue Price” section uses post-issue EPS , the EPS that results after new shares are issued in the IPO. Diluted post-issue EPS is the correct denominator. Using pre-issue EPS produces an artificially low PE and makes the issue look cheaper than it is.
How to Use P/E Ratio Before Applying to an IPO in India
Price to earnings ratio explained in textbooks rarely shows how a retail investor applies it to a live IPO application. The process is direct.
Step one: open the RHP on SEBI’s DRHP portal and find the “Basis for Issue Price” section. This section presents the post-issue diluted EPS and the PE calculated at the issue price. Step two: compare that PE to listed peers. The RHP itself lists peer companies , cross-check their current PE on NSE or BSE rather than relying on the snapshot in the document, which may be dated. Step three: if the IPO PE exceeds the sector peer median by more than 20 to 30%, the issuer is pricing at a premium. The burden shifts to the investor to verify whether that premium is justified by higher revenue growth, stronger margins, or a unique market position.
One trap to watch for: partial-year EPS annualised. A company that earned Rs 8 in nine months may project an annualised EPS of Rs 10.67 , but that assumes Q4 performance holds steady, which may not be true for a seasonal business. Always check whether the EPS in the RHP is from a full audited financial year or an annualised estimate from a partial period.
Investors tracking live IPO schedules alongside their PE research can use the Upcoming IPOs in India 2026 calendar to match open subscription windows with their sector PE analysis.
Limitations of the P/E Ratio Every Investor Should Know
The PE ratio is a useful entry point for company valuation , it is not a complete picture, and treating it as one leads to avoidable errors.
Negative EPS invalidates PE entirely. When a company reports a net loss for the trailing twelve months, the PE ratio is either negative or undefined. It produces no useful output. Investors evaluating loss-making companies should use EV/EBITDA, EV/Revenue, or price-to-sales instead.
One-time gains distort EPS in ways that make the PE look artificially low. A company that sold a manufacturing plant in FY25 and booked a large profit on the transaction will show an inflated EPS for that year. The PE will look attractively low , until that gain disappears from the trailing twelve months, at which point the “real” PE re-emerges, often significantly higher. Always review the notes to accounts in the financial statements before accepting a PE figure at face value.
Accounting policy differences mean two companies with the same PE may have earnings of very different quality. Depreciation methods, revenue recognition timing, and capitalisation versus expensing decisions all affect net earnings. A PE of 20x on a company using conservative accounting is more reliable than 20x on a company using aggressive assumptions.
Finally, the PE ratio ignores debt entirely. A company with Rs 500 crore in debt and Rs 50 crore in annual profit shows the same PE as a debt-free company with identical earnings. Fundamental analysis requires cross-checking PE with the D/E ratio and interest coverage to understand whether reported net earnings are sustainable. Grasping P/E ratio meaning helps an investor know exactly when the ratio is reliable and when to set it aside.
Six Practical Tips on Using P/E Ratio for IPO and Stock Decisions
Applying P/E ratio meaning to real decisions means going beyond theory. These six tips translate the ratio into specific actions before and after IPO subscription.
1. Always use post-issue diluted EPS for IPO PE, not pre-issue EPS. The RHP shows both. Post-issue EPS accounts for the new shares issued in the IPO, which dilutes existing earnings per share. Using pre-issue EPS gives a falsely low and optimistic PE.
2. Compare IPO PE to the sector median, not just one listed peer. A single listed peer may itself be overvalued. Use at least three sector comparables and calculate the median PE. If the IPO PE is above the sector median, the premium needs a clear justification in the RHP’s financials section.
3. Check GMP alongside PE before subscription. A strong GMP combined with a PE below the sector median is one of the more reliable short-listing signals. A high GMP on an IPO with a PE above 80x warrants caution , GMP is secondary market sentiment, not a valuation anchor. Track live grey market data on ipocontrol.in/ipo-gmp-today/ alongside the PE analysis.
4. For loss-making companies, skip PE and use EV/Revenue or EV/EBITDA. If the company has negative EPS , common in new-age technology businesses , the PE ratio produces nothing usable. The RHP’s peer comparison table will typically include EV/EBITDA or price-to-sales multiples in such cases.
5. Look at three years of EPS trend, not just the latest year. A company whose EPS jumped from Rs 2 to Rs 18 in a single year may have benefited from a commodity price peak or a one-time order. A company growing EPS at 18 to 22% annually for three consecutive years presents a more dependable PE reference for projection purposes.
6. Recheck the PE after the basis of allotment is set. Oversubscribed IPOs frequently list at a significant premium to the issue price. At listing, the PE based on the listing price , not the issue price , is the number that matters for a hold-or-sell decision. The post-listing PE may be 30 to 50% higher than what the RHP showed. Investors comparing SME and mainboard PE expectations before applying can refer to ipocontrol.in/mainboard-ipo-vs-sme-ipo/ for sector-level benchmarks.
Frequently Asked Questions , P/E Ratio Meaning
Q1. What is P/E ratio meaning in simple terms? The P/E ratio tells an investor how many rupees the market pays for every one rupee of a company’s annual profit. A PE of 25 means investors are paying Rs 25 per Rs 1 of yearly earnings. It is one of the most widely used stock valuation ratios in fundamental analysis.
Q2. How to calculate P/E ratio step by step? Divide the current market price per share by the earnings per share (EPS). If a stock trades at Rs 600 and its TTM EPS is Rs 30, the PE ratio is 600 ÷ 30 = 20x. For IPO applications, use post-issue diluted EPS, which gives the most conservative and accurate result.
Q3. Can the P/E ratio be negative, and what does it mean? A PE ratio becomes negative when a company’s EPS is negative , meaning the company reported a net loss. A negative PE carries no practical meaning for stock valuation. Investors should switch to EV/EBITDA or price-to-sales for loss-making companies rather than attempting to interpret a negative PE figure.
Q4. Does a high P/E ratio mean a stock is overvalued? Not necessarily. A high PE ratio signals that the market expects strong future earnings growth. If that growth materialises, the multiple compresses as earnings catch up to the price. The stock is overvalued only if earnings fail to grow at the rate the market priced in. Sector context decides whether a high PE is justified , a PE of 60x is high for a steel company but moderate for a fast-growing pharmaceutical brand.
Q5. Where does an investor find the PE ratio of a stock or IPO in India? For listed companies, the PE ratio appears on NSE (nseindia.com) and BSE (bseindia.com) equity pages under “Market Data.” Screener.in provides historical PE charts. For IPOs, the PE at issue price appears in the RHP under “Basis for Issue Price,” published on the SEBI website.
Disclaimer: This article is for educational and informational purposes only and does not constitute investment advice or a recommendation to buy, sell, or hold any securities. ipocontrol.in is not registered with SEBI as an investment advisor. Readers should consult a SEBI-registered investment advisor before making any investment decisions.
One Ratio, Endless Context: P/E Ratio Meaning Across Every Market Condition
The PE ratio is where valuation analysis starts, not where it ends. An investor who pulls the PE figure, compares it to sector peers, checks the earnings trend across three years, and cross-references the D/E ratio has done more pre-application work than most retail participants in India’s IPO market. That extra 20 minutes of research separates a considered application from one driven by grey market sentiment alone.
For IPO investors specifically, the post-issue diluted PE compared to listed peer medians is the single most actionable number in an RHP. When the IPO PE sits below the sector median and the company shows three years of consistent EPS growth, the margin of safety is visible before the allotment. When the IPO PE sits 60% above the sector median with only one year of strong earnings behind it, the risk is equally visible , and equally avoidable.
P/E ratio meaning in stock market is not a formula to memorise and retrieve on demand. It is a lens that calibrates how the market is pricing a company’s future relative to its present earnings. Every retail investor who develops comfort with that lens gains an edge that no GMP alert or broker tip can replicate.
Investors ready to apply this framework to live applications can track current subscriptions and post-issue PE data on the Upcoming IPOs in India 2026 page.